![Boom Logo White.png]](https://www.bbdboom.com/hs-fs/hubfs/Boom%20Logo%20White.png?height=50&name=Boom%20Logo%20White.png)
Custom reports in HubSpot are great for monitoring progress for your campaigns and internal processes.
Sometimes the default reports in HubSpot do not display the data you want to see. This is where custom reports come in.
In the navigation bar, hover over Reporting, then click Reports. Then click Create in the top right corner, and select Create report.
Depending on your subscription, you can create a variety of different custom reports:
- Single object - Use this when you only have one object to report on ie Contacts, Companies, Deals, Activities, Tickets, Products or Feedback submissions.
- Custom report - An advanced report builder that enables you analyse objects in relation to marketing, sales, and service activities.
- Customer journey report - Capture a customer's end-to-end journey in a single report.
- Attribution - You can create several types of attribution reports, such as Contact, Deal or Revenue. These reports will measure the sources and assets that have impacted lead, deal or revenue generation.
- Funnels - Use this report if you want to report through the process of a Contact, Deal or Event funnel.
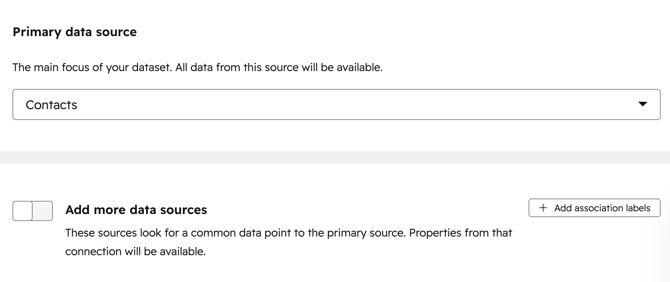
Select Custom report and click Next. From here, choose your primary data source. This is the main focus of your dataset. If you want to report on other objects, switch on the toggle to Add more data sources.
Once you have selected your objects, click Next, which will take you to the report builder.
From here, you can choose which properties you'd like to include in your report, and the type of chart you'd like to build.
To add a filter, click the Filters tab at the top, and drag and drop the properties you'd like to use as filters.
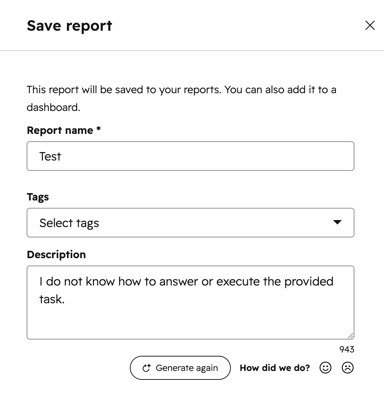
Once you're happy with your report, click Save report in the top right corner. Here, you can name your report, select tags, and add a description. You can also choose whether you'd like to add the report to a dashboard.
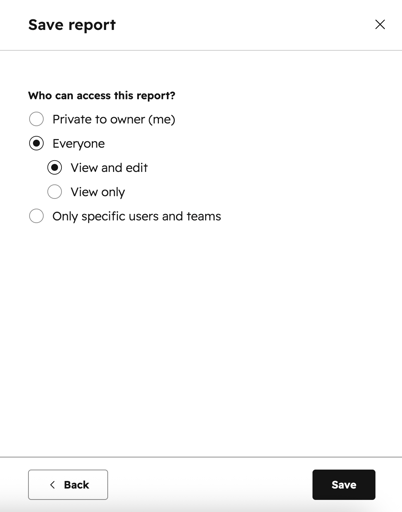
Finally, click Next and select who you'd like to be able to access the report, then click Save.