.jpeg)
All-in-one marketing tools can draw people in with their automation and personalisation capabilities, but for me it always comes back to the reporting features. As the Client Success Director, it’s important to me to be able to see at-a-glance insights into how our clients and our own marketing is performing.
That’s why I love HubSpot’s reporting dashboards. The standard dashboards are impressive enough, but the real power lies in being able to create custom dashboards and reports in order to gain the insight needed to focus marketing efforts and budget on what is actually working. In fact, no matter what marketing automation platform (MAP) you use, KPI dashboards are an important feature to look out for.
When it comes to using your dashboards effectively, here are my tips:
1- Create your dashboards strategically
Remember that they key phrase here is KPI (key performance indicator). These aren’t comprehensive marketing dashboards with reports for every possible marketing metric you could measure. They should be focused on the most important metrics only. Here is some advice from HubSpot’s Rob Ristagno on the matter:
“If you're not sure which data points to focus on, think of it this way: what handful of things could totally tank your business if they went south? Framing it that way can help you sort the vanity metrics from the things that matter.”
HubSpot recommends including no more than 5-9 reports on each dashboard. The maximum is 10, but for each category you really shouldn’t need more than half that to get an effective top-line view. This means being strategic about what reports you include.
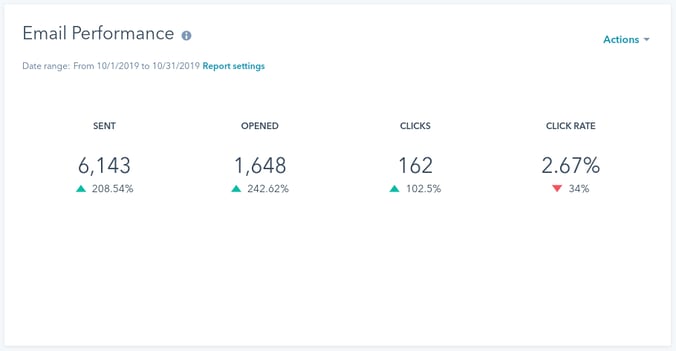
The best dashboards should not only provide a health check for your existing activity but also allow you to make strategic decisions about the future based on the insights they offer. Reports that display short-term results like the Marketing Performance report are certainly important, but reports that incorporate longer-term trends are arguably more useful for decision-making.
2- Check them frequently
Your KPI dashboards should be incredibly focused as we’ve discussed above, so you’ll likely want to check them frequently. This frequency likely depends on the volume you’re experiencing and the timing of your campaigns. If you have hundreds of leads coming in every day or have a campaign launching, daily KPI check-ins can be helpful. But for lower-volume businesses, weekly is fine as well.
What you don’t need to do frequently is pour over the more detailed reporting available in your MAP. Your KPI dashboards should be comprehensive enough to alert you to anything worth paying attention to. Which brings us to...
3- Question any anomalies
Seasoned marketers know that peaks and troughs are inevitable, and most anomalies will be smoothed over with time. However, if you’re following the advice from HubSpot we shared, these KPIs are vital to your business.
For this reason, it’s important to follow up on any anomalies, good or bad. You might be tempted to wait to see if it evens out, but if something has gone wrong that you’re picking up in your KPI dashboards, it’s important to query it with your team to make sure it’s nothing to worry about. They probably have an answer and know exactly why the numbers are behaving the way they are, but getting that information as soon as possible will help inform your interpretation of the data you’re seeing in your dashboards.
Likewise, you’ll want to question positive anomalies as well. Whilst campaign successes can be discussed at regular check-ins and replicated in the future, you want to make sure you’re capitalising on any interest being displayed by your audience, and positive upticks in your KPIs could indicate such an opportunity. Acting on it quickly could exponentially improve your results.
4- Review them periodically
Whilst your KPIs should not be changing frequently, it’s worth revisiting your dashboards quarterly or semiannually to make sure they’re providing the insight you need to make informed, strategic decisions. Just remember to be selective with what you display and remove so that you don’t end up bogged down in vanity metrics and irrelevant data.
Our Top 3 KPI Dashboard Recommendations for Marketing
If you’re looking for a bit more guidance on how to get started building dashboards within HubSpot, here are the top 3 marketing KPI dashboards we recommend starting with:
.jpg?width=5934&name=austin-distel-744oGeqpxPQ-unsplash%20(1).jpg)
Paid media dashboard
If you’re spending money on social media advertising, it’s important to be able to track how that investment is being returned. HubSpot is constantly improving its integrations with social advertising platforms, and the dashboards available are equally useful. Here are the most important reports for a paid media KPI dashboard:
- Ads attributed contacts by social network
- Ad campaigns with cost per click
- Ad campaigns with cost per contact
- New contacts by source
Web analytics dashboard
There are practically countless reports you could run for a web analytics dashboard, but remembering that these are KPIs only, here is what we recommend including:
- Marketing performance
- New marketing qualified leads by source
- New customers by source (custom report – same as above, but with “became a customer date” selected rather than “became a marketing qualified lead date”)
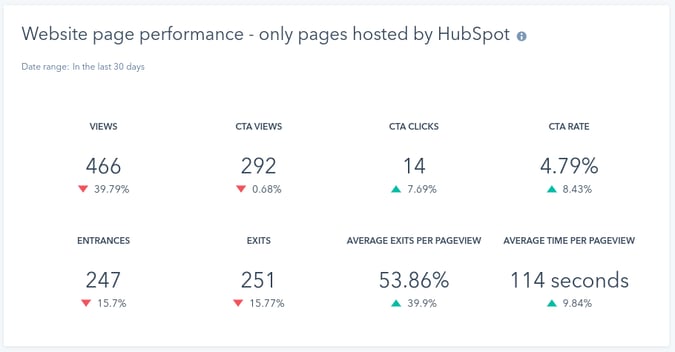
- Website page performance - only pages hosted by HubSpot
- Blog posts performance
- Landing page performance
- Top landing pages by new contacts
- Top landing pages by new submissions
Attribution reporting dashboard
If your sales team also uses HubSpot or you’re integrated with your company’s CRM, you can use an attribution reporting dashboard to visualise exactly how much money is coming from which sources. There are six different attribution models available, allowing you to weight interactions and conversions in the way you feel is most appropriate for your business.
When compared to the budget being spent on each lead source, this will help you see where you’re getting the best (and worst) return on investment. Then you can make more strategic budgetary decisions in your marketing, confident that you’re investing in the sources that work best for you.
The Ultimate Marketing KPI Dashboard
If you want to combine all these dashboards into one powerhouse dashboard you can look at regularly to stay up-to-date on all these things, here are the reports we recommend including:
- Marketing performance
- New contacts by source
- New MQLs by source
- New customers by source
- Ads attributed contacts by social network
- 2x attribution reports of different models
With these 6 reports, you’ll get a top-level view into your marketing performance and how it translates into tangible revenue for the business. This level of insight is imperative if you’re going to scale your marketing and grow your business, and HubSpot’s reporting dashboards are the best way to get it all in one place.
To learn more about how we use HubSpot for reporting and KPI review, click here to get in touch with a member of our team.


-2.jpg)


.jpg)
.jpg)


-1.png)
.webp?width=98&height=94&name=HubSpot%20Elite%20Badge%20(2).webp)